

After a stellar 2025 in which emerging market (EM) equities returned 34%, 2026 is off to a good start with the MSCI EM Index up 7% year to date. Last year’s near doubling of the S&P 500 return was driven mostly by a weakening U.S. dollar, which propped up EM returns, but attractive valuations and artificial intelligence (AI) investment played a role. This week we highlight five reasons we’ve warmed up to EM.
#1: U.S. Dollar Looks Like It Wants to Go Lower
Given the dollar was one of, if not the biggest drivers of EM outperformance last year, we’ll start there. The U.S. Dollar Index is on the cusp of breaking a long-term uptrend. Further weakness would potentially introduce 5% downside or more from a technical analysis perspective. Prospects for two more rate cuts from the Federal Reserve (Fed) and a Trump Administration comfortable with a weaker (but stable) dollar to help balance trade increase the likelihood of a breakdown in the currency at some point.
In addition, in a sanction-heavy geopolitical environment that kicked into high gear when Russia invaded Ukraine, central banks around the world have looked to diversify away from the greenback — the rally in gold over the past couple of years provides evidence. Finally, there is a structural anchor on the dollar in the still large — but slightly shrinking — trade deficit with the rest of the world. The more the U.S. spends on imports, the more global supply of dollars there is to weigh on its price based on supply and demand.
One risk to our bearish dollar bias is sticky inflation, which could delay Fed rate cuts. We could also get a technical bounce off 96 due to potential safe haven buying if economic and market conditions worsen (not our base case). A dollar bounce could also come from the incoming Fed Chair signaling a more hawkish bias.
U.S. Dollar Is on the Cusp of a Major Technical Breakdown
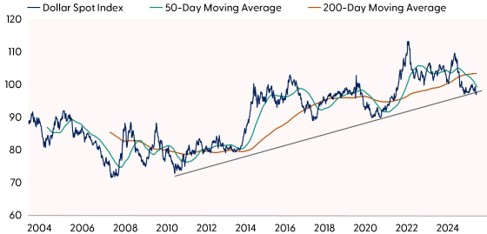
Source: LPL Research, Bloomberg, 02/05/26
Disclosures: All indexes are unmanaged and cannot be invested in directly. Past performance is no guarantee of future results.
#2: Earnings Growth Is Accelerating
Our hesitation to jump on the EM bandwagon until our upgrade to neutral in early 2025 was centered on earnings. We would attribute much of the EM underperformance since the 2008–2009 Global Financial Crisis to earnings disappointment (though a strong U.S. dollar was another meaningful piece of the story). Year after year, EM fell short of optimistic earnings expectations. In fact, the consensus estimate for EM earnings per share (EPS) this year of around $90 is the same level as 2011, while EPS for the S&P 500 is up over 170% over the same time period.
So, is this time different? These may be the most dangerous words in investing, but we believe it may be. AI is a big reason why. Earnings for EM are expected to outgrow the U.S. and developed international markets (represented by the MSCI EAFE) this year — and there probably isn’t enough time for that to change given we’re in fourth quarter earnings season. For the record, EM earnings are tracking to 16% in the fourth quarter, slightly ahead of the U.S. at 13%.
In 2026, EM earnings are expected to grow 29%, more than double current earnings growth expectations for the U.S. at 14%. EM may miss those lofty expectations, but the avalanche of AI investment in Asia and increased focus on corporate governance, efficient capital allocation, and shareholder returns, including in China, South Korea, and India, position EM earnings and cash flows to potentially outgrow the U.S. as well as Europe and Japan in 2026.
EM Earnings Growth Is Strong and Getting Stronger
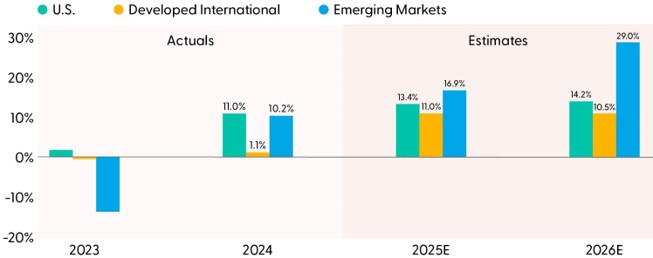
Source: LPL Research, FactSet, 02/05/26
Disclosure: Earnings data based on MSCI EAFE, MSCI Emerging Markets, and S&P 500 Indexes.
All indexes are unmanaged and cannot be invested in directly. Past performance is no guarantee of future results. Estimates may not materialize as predicted and are subject to change.
#3: Exposure to AI Boom in Asia
In what may be a surprise to some, the MSCI EM Index has as big an allocation to the technology sector as the S&P 500 at slightly over 30%. Not only is EM a play on AI, as China has made advances and is well positioned to benefit from the new technology, but much of the AI chips and hardware needed for AI data centers comes from Asia.
Nearly all of the world’s advanced chips come from Taiwan, although the U.S. does plan to whittle that down in the coming years. We don’t need to tell anyone reading this that Samsung in Korea is a leading global technology player. And as we learned last week from the tech giants reporting earnings in the U.S., including Alphabet (GOOG/L) and Amazon (AMZN), the massive AI investments planned for 2026 keep growing. The anticipated hyperscaler capex for this year before fourth quarter earnings season began was about $520 billion and now appears headed for $650 billion or more.
Emerging Markets Index Is As Tech Heavy As the U.S
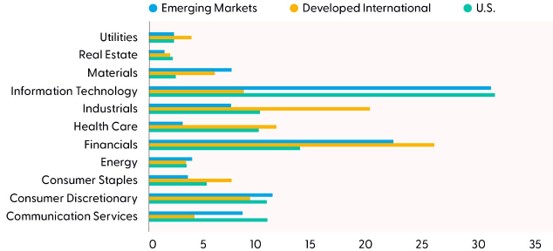
Source: LPL Research, FactSet, 02/05/26
Disclosures: All indexes are unmanaged and cannot be invested in directly. Past performance is no guarantee of future results.
As the accompanying chart illustrates, much of the heavy technology weighting in the EM index comes from Asia, where the top country weightings are China, Taiwan, Korea, and India. In fact, the biggest non-Asia country weighting in the EM index is Brazil at 4.6%.
The Overwhelming Majority of the EM Index is Based in Asia
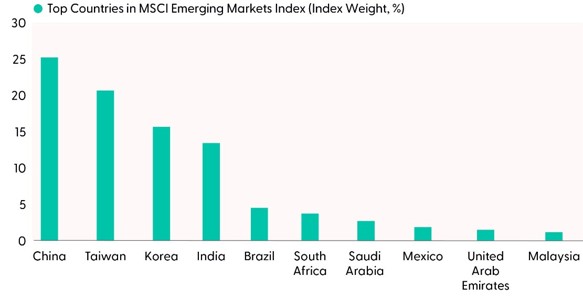
Source: LPL Research, FactSet, 02/05/26
Disclosures: All indexes are unmanaged and cannot be invested in directly. Past performance is no guarantee of future results.
#4: Technical Analysis Trends Are Compelling
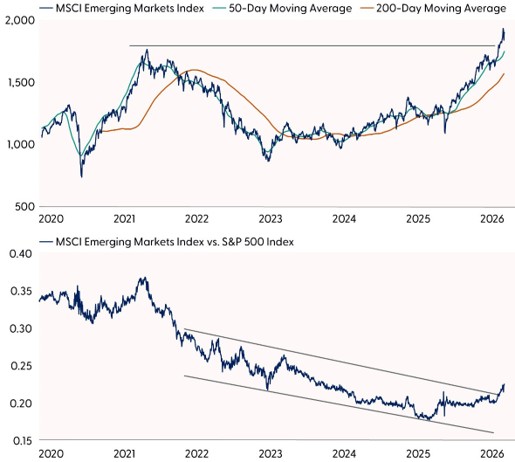
Emerging markets opened 2026 with sustained momentum and notably low volatility, a trend that really started back in April 2025. The technical backdrop remains constructive as the MSCI EM Index recently cleared major resistance stemming from its 2021 highs. Participation in the move has been broad, with more than two-thirds of constituents trading above their 200-day moving average and roughly 20% of the index sitting within 5% of new 52- week highs.
Relative performance trends are strengthening as well. The MSCI EM Index vs. the S&P 500 ratio chart has reversed a multi-year downtrend and reached its highest level in over two years. This decisive breakout — supported by confirming momentum indicators — signals the development of a new relative uptrend, reinforcing the bullish technical case and increasing the likelihood of additional EM outperformance ahead.
EM Has Broken Out on an Absolute and Relative Basis
Source: LPL Research, Bloomberg, 02/05/26
Disclosures: All indexes are unmanaged and cannot be invested in directly. Past performance is no guarantee of future results.
#5: Attractive Valuations
We point out all the time that valuations are not good timing tools. However, once a trend changes that is based on fundamentals or technical factors, the moves tend to be bigger if they have valuation support. EM equities were about 15% cheaper than their U.S. counterparts at the end of 2010 on a forward price-to-earnings ratio (P/E) basis, but the EM Index proceeded to return 2.3% annualized over the next 15 years while the S&P 500 returned 13.8% annualized.
EM flipped the script in 2025, but not until the EM valuation discount had fallen to near 50%. Now at a 40% discount, EM valuations remain compelling. The difference is that we have fundamental improvement and several positive technical analysis developments that suggest improved performance may be sustainable.
We also know that periods of EM outperformance (and underperformance) tend to be long, as in 2003-2010 when EM outperformed the U.S. Over long time periods, valuations tend to be more useful. So, if this is the start of a long cycle in EM, current valuation levels may allow for substantial additional outperformance.
Conclusion
We maintain our positive bias toward EM. LPL Research suggests investors maintain EM equities exposure at least in line with their targets and think about finding some dry powder to add more. There are several reasons to like EM equities right now. We put the most weight on the potential for further dollar weakness, accelerating earnings, and exposure to the global AI supply chain. Meanwhile, our technical analysis work suggests the latest run of outperformance is more likely than not to continue. And finally, EM’s history of long sustained moves coupled with attractive valuations set the stage for a potential multi-year run.
Asset Allocation Insights
LPL’s STAAC maintains its tactical neutral stance on equities. Investors may be well served by bracing for occasional bouts of volatility, such as those experienced last week. A lot of optimism is still reflected in stock valuations, but fundamentals remain broadly supportive. Technically, the broad market’s long-term uptrend remains intact, leaving the Committee biased to add equities exposure on potential further weakness.
STAAC’s regional preferences across the U.S., developed international, and EM are aligned with benchmarks, though an improving fundamental and technical analysis picture in EM is noteworthy. The Committee still favors a slight growth style tilt, but value’s strong start to the year has our attention. In terms of domestic sectors, healthcare, industrials, and technology remain on our shopping list, while our conviction on communication services as an overweight has waned recently due to deteriorating technical analysis trends and the mostly negative reaction to fourth quarter earnings.
Within fixed income, the STAAC holds a neutral weight in core bonds, with a slight preference for MBS over investment-grade corporates. The Committee believes the risk-reward for core bond sectors (U.S. Treasury, agency MBS, investment-grade corporates) is more attractive than plus sectors. The Committee does not believe adding duration (interest rate sensitivity) at current levels is attractive and remains neutral relative to benchmarks.
Important Disclosures
This material is for general information only and is not intended to provide specific advice or recommendations for any individual. There is no assurance that the views or strategies discussed are suitable for all investors or will yield positive outcomes. Investing involves risks including possible loss of principal. Any economic forecasts set forth may not develop as predicted and are subject to change.
References to markets, asset classes, and sectors are generally regarding the corresponding market index. Indexes are unmanaged statistical composites and cannot be invested into directly. Index performance is not indicative of the performance of any investment and do not reflect fees, expenses, or sales charges. All performance referenced is historical and is no guarantee of future results.
Any company names noted herein are for educational purposes only and not an indication of trading intent or a solicitation of their products or services. LPL Financial doesn’t provide research on individual equities.
All information is believed to be from reliable sources; however, LPL Financial makes no representation as to its completeness or accuracy. All investing involves risk, including possible loss of principal.
US Treasuries may be considered “safe haven” investments but do carry some degree of risk including interest rate, credit, and market risk. Bonds are subject to market and interest rate risk if sold prior to maturity. Bond values will decline as interest rates rise and bonds are subject to availability and change in price.
The Standard & Poor’s 500 Index (S&P500) is a capitalization-weighted index of 500 stocks designed to measure performance of the broad domestic economy through changes in the aggregate market value of 500 stocks representing all major industries.
The PE ratio (price-to-earnings ratio) is a measure of the price paid for a share relative to the annual net income or profit earned by the firm per share. It is a financial ratio used for valuation: a higher PE ratio means that investors are paying more for each unit of net income, so the stock is more expensive compared to one with lower PE ratio.
Earnings per share (EPS) is the portion of a company’s profit allocated to each outstanding share of common stock. EPS serves as an indicator of a company’s profitability. Earnings per share is generally considered to be the single most important variable in determining a share’s price. It is also a major component used to calculate the price-to-earnings valuation ratio.
All index data from FactSet or Bloomberg.
This research material has been prepared by LPL Financial LLC.
| Not Insured by FDIC/NCUA or Any Other Government Agency | Not Bank/Credit Union Guaranteed | Not Bank/Credit Union Deposits or Obligations | May Lose Value |
For public use. Member FINRA/SIPC. RES-0006657-0126 Tracking #1061925 | #1061926 (Exp. 02/27)